Retiree Perspectives: Part 7: What is the relationship between happiness and retiree attitudes?
Background:
In late 2021, the Retirement Research Center (RRC) surveyed over 2,000 retired workers to gauge attitudes about savings, spending, and financial wellness in retirement. As reported in Part 1, four distinct segments were found in the study: Confident Retirees, Optimistic Thrifty Retirees, Nervous Retirees, and Struggling Retirees. Each segment has significant differences related to their spending (relative to ability), financial situation, confidence, and planning.
This is part 7 of the RRC’s Research Minute series about this study and focuses on self reported happiness among retirees. We evaluated happiness across segments and also across demographics such as gender and marital status.
Findings:
Survey participants were asked to rank their overall happiness on a scale of 10 to 1, ranging from “as good as I can imagine it could get” to “as bad as I can imagine life could get.” Optimistic Thrifty Retirees report being the most content, with 43% reporting feeling “very happy.” Confident Retirees and Nervous Retirees reported similar happiness levels, which is interesting considering that Nervous Retirees also reported feeling less financial confidence. Conversely, Struggling Retirees are more apt to be somewhere in between, and 7% reporting very low scores of “unhappy.”

**Score 9 and 10 = very happy, 7 and 8 = happy, 4 to 6 = somewhere in between and 1 to 3 = unhappy
When evaluated by gender across varying demographics, we found no differences in reported happiness. However, there are large differences when we look at happiness levels by marital status. Married retirees are the happiest overall, regardless of gender. Single retirees were the least likely to report being “very happy,” and their overall happiness levels are below those of divorced and widowed retirees.
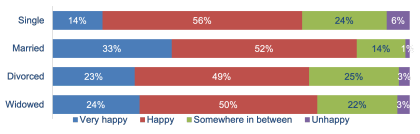
**Score 9 and 10 = very happy, 7 and 8 = happy, 4 to 6 = somewhere in between and 1 to 3 = unhappy.
Bottom line:
When considering the self-reported happiness levels of retirees, happiness does not always correlate with greater levels of financial security. However, we see that the Struggling segment has relatively lower levels of self-reported happiness, which could be associated with their greater financial insecurity and less optimistic attitudes toward retirement spending.