Is probability of success the wrong measure for retirement outcomes?
Guest Contributor: David Blanchett, Head of Retirement Research, Prudential Financial and Portfolio Manager, PGIM
Background:
The most common metric used in retirement planning to assess whether someone is “on track” is to meet a retirement income goal is the probability of success—or the number of Monte Carlo simulations in which the goal is fully achieved.
This success-related metric treats the outcomes as binary and provides no context on the magnitude or timing of shortfalls. It doesn’t distinguish between missing a goal by $1 versus $1 million or failing in year 10 versus year 30. An alternative approach is to estimate the percentage of the goal achieved, also referred to as the goal completion percentage.
These two metrics can tell very different stories about how well (or poorly) someone is meeting a financial goal. The difference is demonstrated in the table below, where the goal is to generate $100 per year for 10 years.

While the scenario has a 50% probability of success, 96% of the goal is accomplished, on average, across the ten scenarios. Both metrics use identical assumptions but convey sharply different perspectives about the goal’s viability.
Findings:
To understand how individuals interpret these metrics, Morning Consult surveyed 2,121 adults in October 2025. The analysis includes only respondents with $100,000 in investable assets, reducing the sample to 396 individuals.
When asked which metric is more helpful in determining retirement spending, 47% selected goal completion percentage, 42% selected the probability of success, and 11% weren’t sure. Interest in probability of success was generally higher among younger respondents, while goal completion was more popular among older respondents.
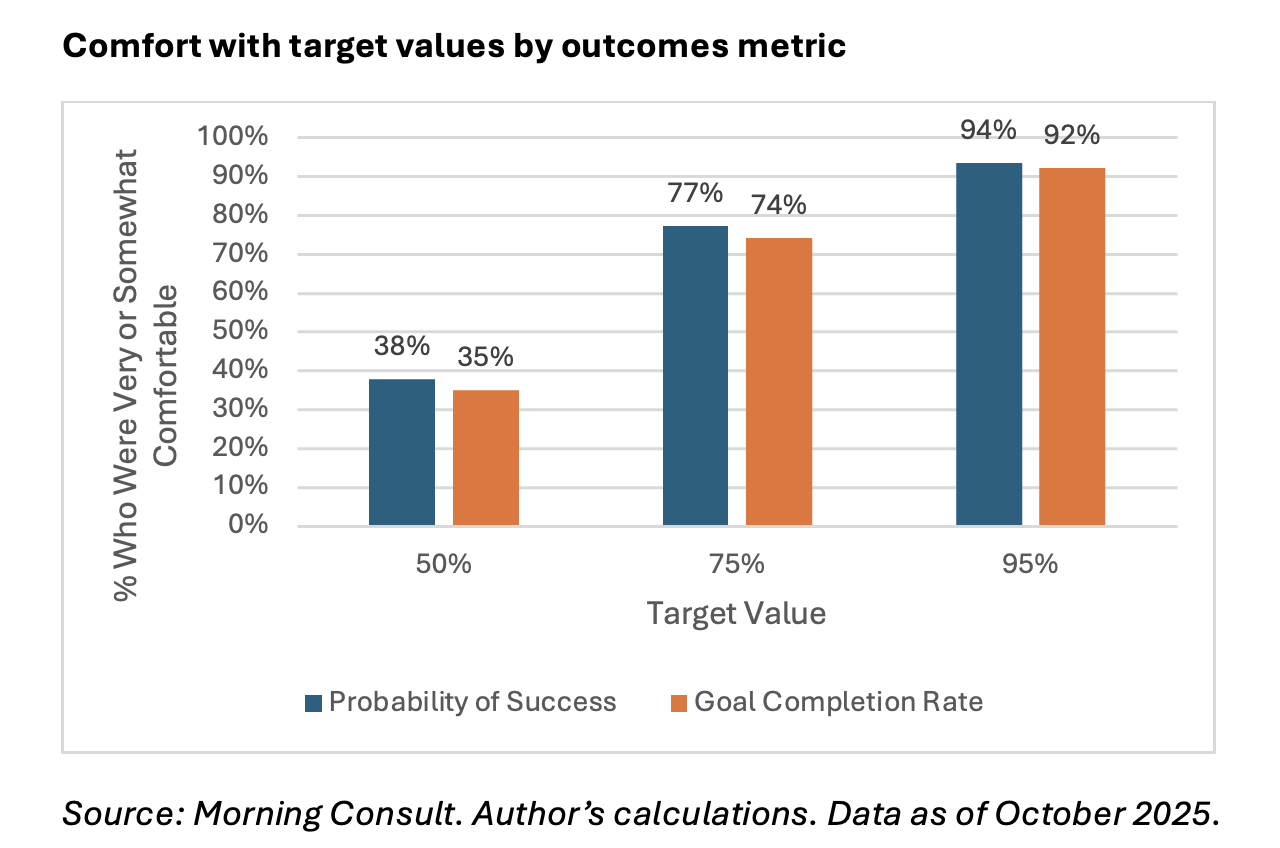
Next, respondents were asked about their comfort level with a specific metric and target value. For example, “if a financial advisor told you your chance of success was 80%, how comfortable would you feel implementing that plan?” The respondents felt similarly about implementing the respective target values, as illustrated in the next exhibit.
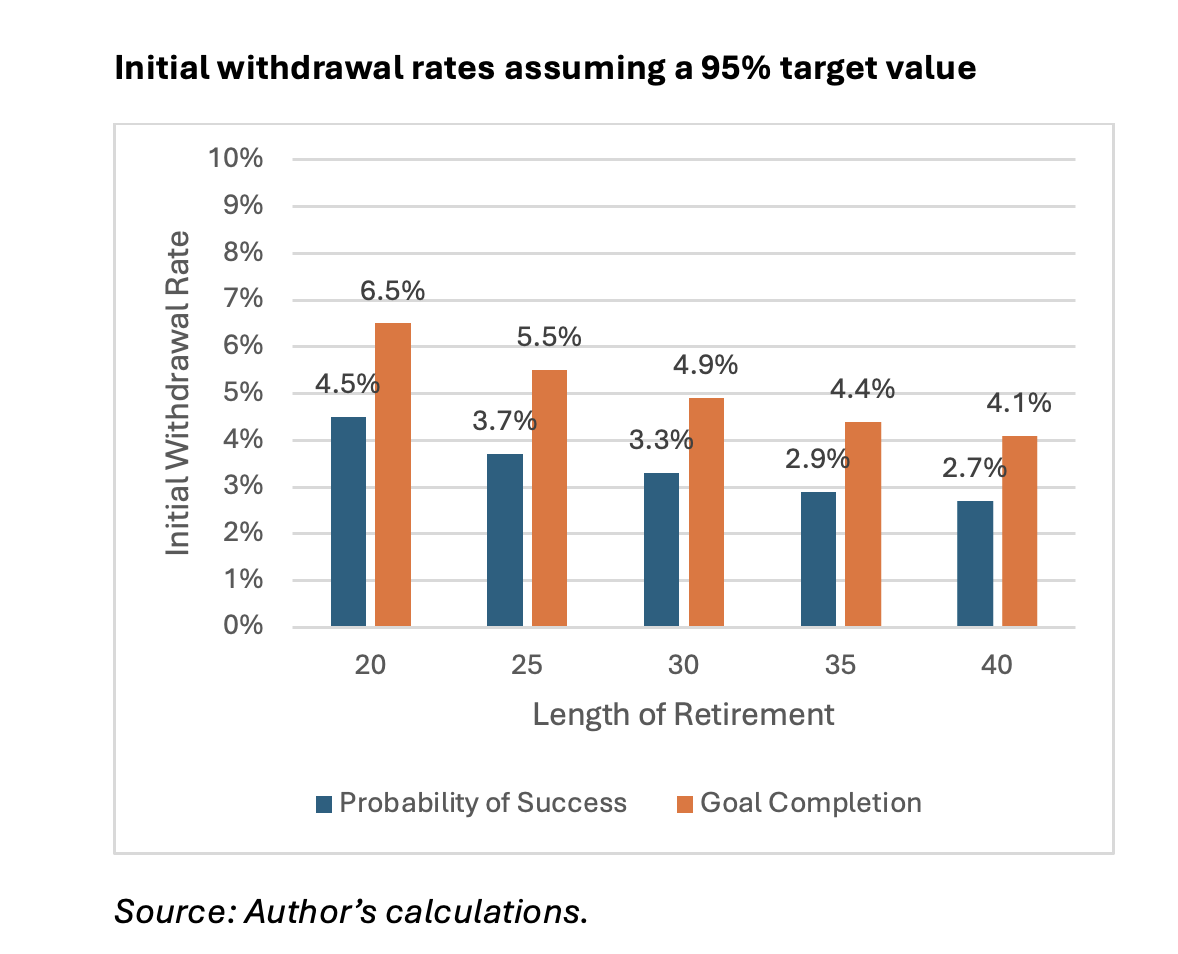
These metrics can result in significantly different perspectives when determining optimal retirement strategies. For example, the next exhibit illustrates how safe initial withdrawal rates would vary across the two metrics, assuming a 95% target value over different retirement periods, and goal completion rates can result in significantly higher than success rates.
Bottom Line:
How we quantify outcomes has significant implications for our recommendations. The probability of success offers an incomplete perspective about what it means to achieve a financial goal and can lead to suboptimal retirement planning decisions.
From a participant behavior perspective, goal completion percentage may serve as a better participant communication metric. The framing has several participant behavior advantages including potentially helping increase engagement by showing a direct connection between participant behavior (saving more, retiring later etc.) and improved goal completion and creating a sense of achievement by focusing on progress rather than a statistical uncertainty.
Defining outcomes as all-or-nothing can obscure meaningful information about the severity and timing of potential shortfalls. Incorporating goal completion percentage provides a more nuanced and informative framework—one that can better support decision-making and lead to more informed and aligned retirement strategies.
---
Insights shared by guest contributors are their own and do not represent the views of DCIIA or the RRC. The opinions voiced in this material are for general information only and are not intended to provide specific advice or recommendations for any individual.